In this article, I build end-to-end deep neural networks to predict Food delivery time prediction using deep learning.⏱️
This is a very helpful article. After reading this article you solve different types of regression problems such as stock price prediction📊, house price prediction🏠, and many more. Because the same concept applies to all deep-learning problems.
Keep reading 🔥
What Real-World Problem We Are Solve Using Deep Learning
When you order food these types of companies such as JustEat, DoorDash, Zomato, Swiggy and etc. This company provides you delivery person’s name, mobile number, and how much time it takes for delivery successfully. Most people already guess which thing to solve in this article.
Our job is to build a deep learning model to predict how much time it takes for delivery successful based on past data.
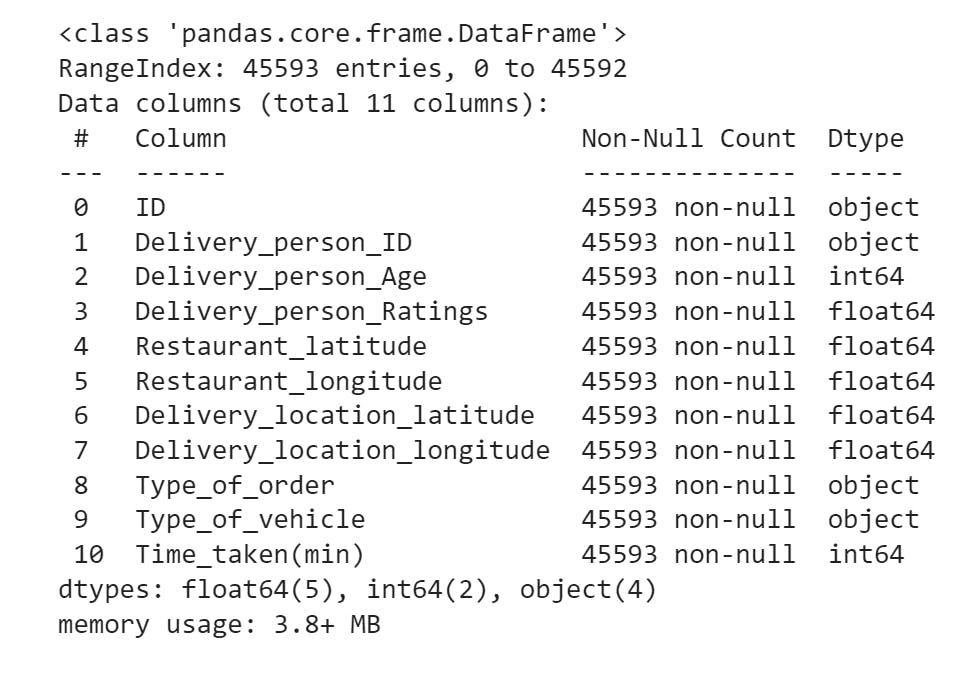
In this dataset under 11 columns and each of these columns is under 45593 value store.
This column represents as a delivery partner how much time to take for delivery successful in the past days.
Now look closely at each of these columns ⤵️
ID— It’s unique and the order Id number.Delivery_person_ID— It is the unique ID number of the Delivery partner.Delivery_person_Age— This is the actual age of the delivery partnerDelivery_person_Rating— It’s a rating of the delivery partner based on past deliveries.Resturant_latitude— It’s the latitude of the Restaurant.Resturant_longitude— It’s longitude of Resturant.Delivery_location_latitude— It’s the latitude of actual delivery locationsDelivery_location_longetude— It’s longetude of actual delivery locations.Type_of_order— This is a type of meal ordered by a customer.Type_of_vehicle— This is a type of vehicle delivery partner ride on.Time_taken(min)— It’s the actual time taken by a delivery partner to complete this order.
Import Some Require Libary we need solve this problem.

import pandas as pd
import numpy as np
import plotly.express as px
import tensorflow as tf
from keras.models import Sequential
from keras.layers import Dense, LSTM,Dropout,GRU
from sklearn.preprocessing import LabelEncoder
from sklearn.model_selection import train_test_split
Load Data Into Panda DataFrame
Now time to move on and load data into pandas DataFrame. Use the read_csv ( ) function to read the txt file as well.
dataframe = pd.read_csv("/content/drive/MyDrive/new_article/FoodDeleveryTimePrediction/deliverytimehistory.txt")
dataframe

Use the info( ) method in pandas to display dataFrame information. ⤵️
dataframe.info()
Make sure our dataset does not have any null value. ⤵️
dataframe.isnull().sum()
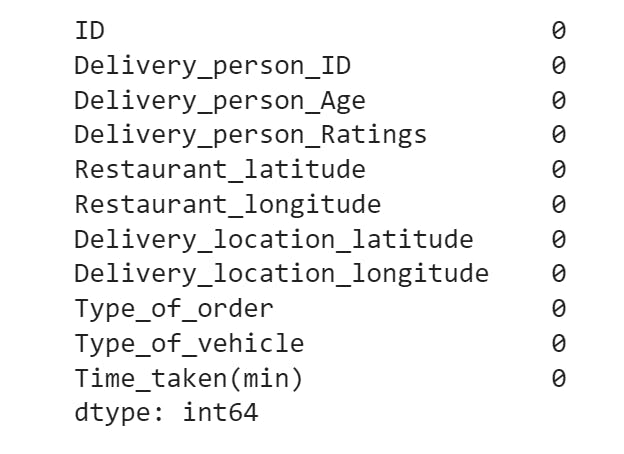
If you see our dataset doesn’t have any null value. Now move next section!
Insert New Distance Column in DataFrame 🗺️
In this section, I create a small function to calculate the distance between the restaurant and the delivery location.
I am also adding the distance column in my pandas dataFrame! 🐼
# Set the earth's radius value (in kilometers)
R = 6371

# Convert degrees to radians
def degree_to_radians(degrees):
    return degrees * (np.pi/180)

# Using herversine formula to calculate the distance between to points
def distcalculate(lat1, lon1, lat2, lon2):
    d_lat = degree_to_radians(lat2-lat1)
    d_lon = degree_to_radians(lon2-lon1)
    a = np.sin(d_lat/2)**2 + np.cos(degree_to_radians(lat1)) * np.cos(degree_to_radians(lat2)) * np.sin(d_lon/2)**2
    c = 2 * np.arctan2(np.sqrt(a), np.sqrt(1-a))
    return R * c

# Calculate the distance between each pair of points
dataframe['distance'] = np.nan

for i in range(len(dataframe)):
    dataframe.loc[i, 'distance'] = distcalculate(dataframe.loc[i, 'Restaurant_latitude'],
                                        dataframe.loc[i, 'Restaurant_longitude'],
                                        dataframe.loc[i, 'Delivery_location_latitude'],
                                        dataframe.loc[i, 'Delivery_location_longitude'])
The above step is complete now display the dataFrame and see what looks like the distance column.
dataframe

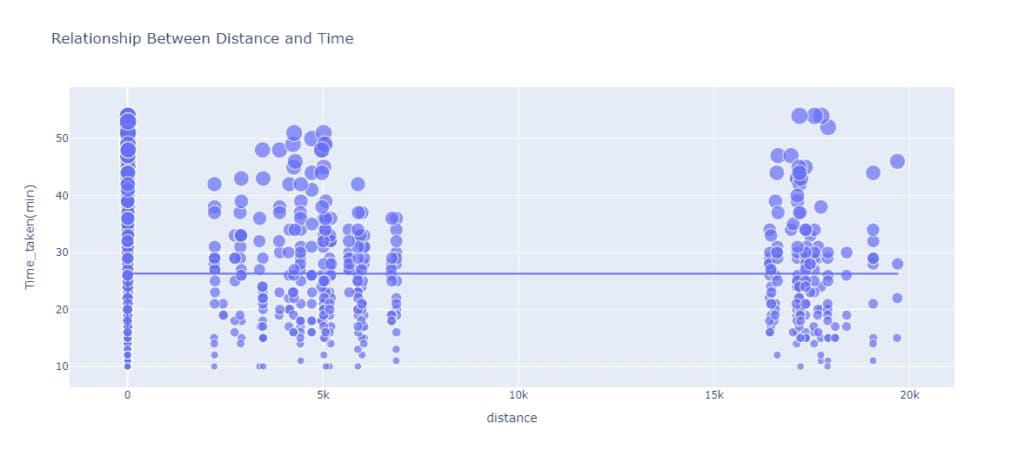
Display Relationship Between Distance And Time
At this time I am using the matplotlib library to display the relationship between two columns such as distance and time. See the code below!
figure = px.scatter(data_frame = dataframe,
                    x="distance",
                    y="Time_taken(min)",
                    size="Time_taken(min)",
                    trendline="expanding" ,
                    title = "Relationship Between Distance and Time")
figure.show()
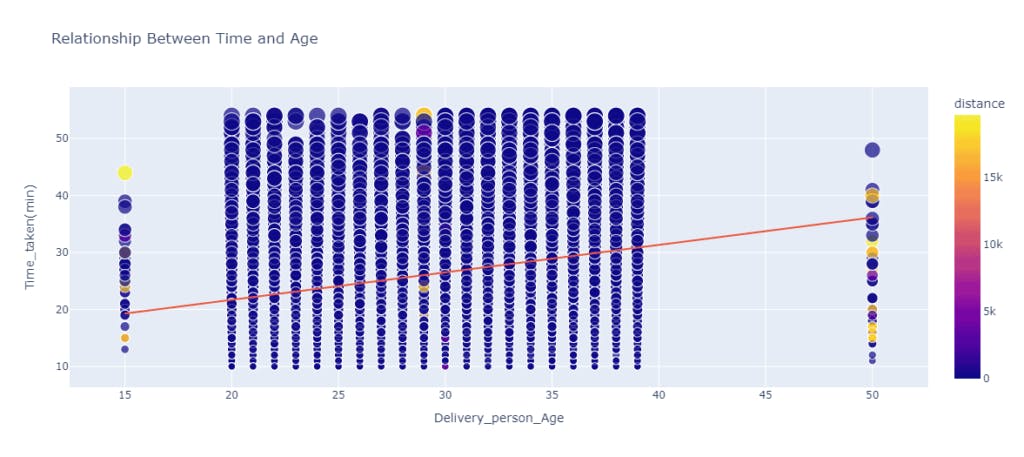
Display Relationship Between Time And Age
Once again see the relationship between the time and age column.
figure = px.scatter(data_frame = dataframe,
                    x="Delivery_person_Age",
                    y="Time_taken(min)",
                    size="Time_taken(min)",
                    color = "distance",
                    trendline="ols",
                    title = "Relationship Between Time and Age")
figure.show()
Display Relationship Between Time and Ratings
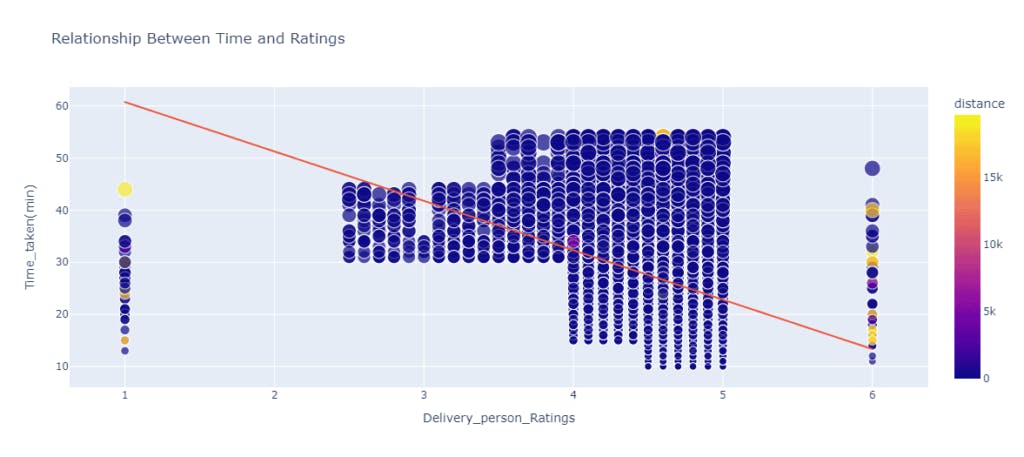
Again to see the relationship between time and rating. 🌟🌟⏱️
figure = px.scatter(data_frame = dataframe,
                    x="Delivery_person_Ratings",
                    y="Time_taken(min)",
                    size="Time_taken(min)",
                    color = "distance",
                    trendline="ols",
                    title = "Relationship Between Time and Ratings")
figure.show()
Display Relationship Between Time and Type of Vehicle
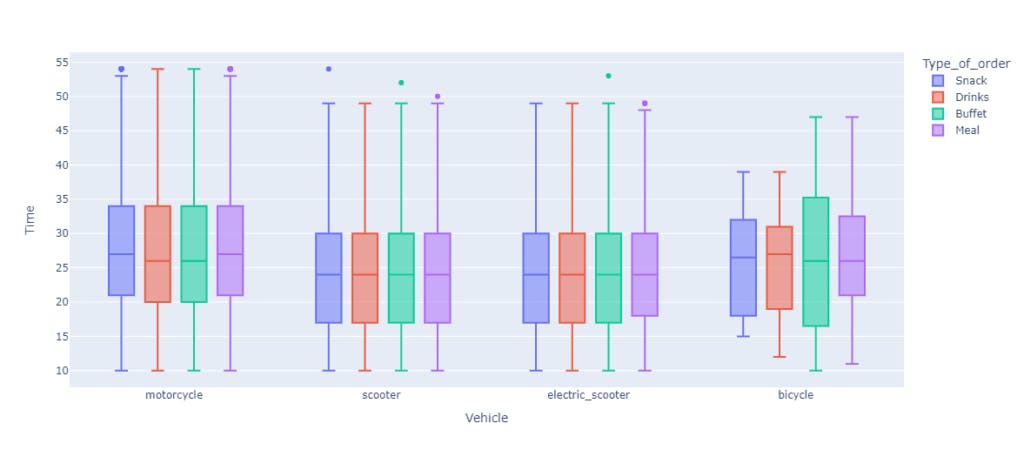
The final step is to examine the relationship between time and the type of vehicle.
fig = px.box(dataframe,
             x="Type_of_vehicle",
             y="Time_taken(min)",
             color="Type_of_order",
             labels={"Type_of_vehicle": "Vehicle","Time_taken(min)":"Time"})
fig.show()
Encoding Some Label Value
In this section, I am working with label encoding. This means any string object represents a numerical value.
As you also know, my data set is under a vehicle and the type of order is a string object that is not supported when I train a model. So the first step is to convert all string objects to the numerical value.
le = LabelEncoder()

dataframe['Type_of_vehicle'] = le.fit_transform(dataframe['Type_of_vehicle'])
vehicle_label = le.classes_
dataframe['Type_of_order'] = le.fit_transform(dataframe['Type_of_order'])
order_label = le.classes_
dataframe

If you see that my two columns under all values successfully label encoding. You can also see that the Delivery person id column has a string value. But that column is not important in this project so, I drop this column in the next section.
Split Dataset Into Training And Testing Categories
This is a very important topic in deep learning and machine learning project that split datasets into training and testing sets. 🤖 At this time I divided my dataset into train and test sets. Because when my deep learning model training is complete than next step is to check model prediction accuracy. This time I am using a testing dataset. 💯
Always remember 💥: When you build any deep learning model, first split dataset training and testing set!
# x variable store features column with value.
# Also note that not store restaurant and delivery location longitude and latitude
# Becuse these two column combine of distance column.

x = np.array(dataframe[["Delivery_person_Age",
                   "Delivery_person_Ratings",
                   "distance",
                   'Type_of_vehicle',
                   'Type_of_order']])

# y variable store target column
y = np.array(dataframe[["Time_taken(min)"]])


# If the  above step is complete now split them train and test set
xtrain, xtest, ytrain, ytest = train_test_split(x, y,
                                                test_size=0.10,
                                                random_state=42)

xtrain

Build Neural Network And See Summary
In this section, I build a simple deep neural network for predicting food delivery time.


At that time I am using TensorFlow for creating deep neural networks. You can also use PyTorch and other frameworks which suitable for you.
model = Sequential()
model.add(LSTM(128,return_sequences=True,input_shape=(xtrain.shape[1],1)))
model.add(GRU(128,return_sequences=False))
model.add(Dense(64))
model.add(Dropout(0.2))
model.add(Dense(1))

model.summary()

Model Compile And Train
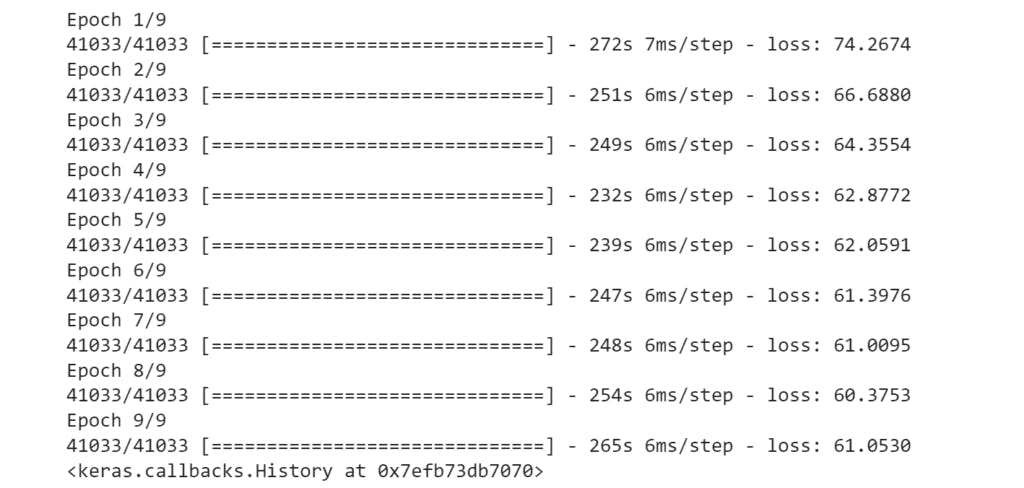
When the model architecture is ready now move on compile and train them with the training dataset.
$$🤖$$
model.compile(optimizer=tf.keras.optimizers.Adam(),
               loss='mean_squared_error')
model.fit(xtrain,ytrain,batch_size=1,epochs=9)
Model Evaluate
Once the model trains successfully now time to evaluate the model with a testing dataset. It checks for model performance on unseen data.
$$💯$$
model.evaluate(xtest,ytest)

# OUTPUT 🔻
# 143/143 [==============================] - 2s 4ms/step - loss: 54.6020
# 54.60203552246094
Predict Some Demo Examples
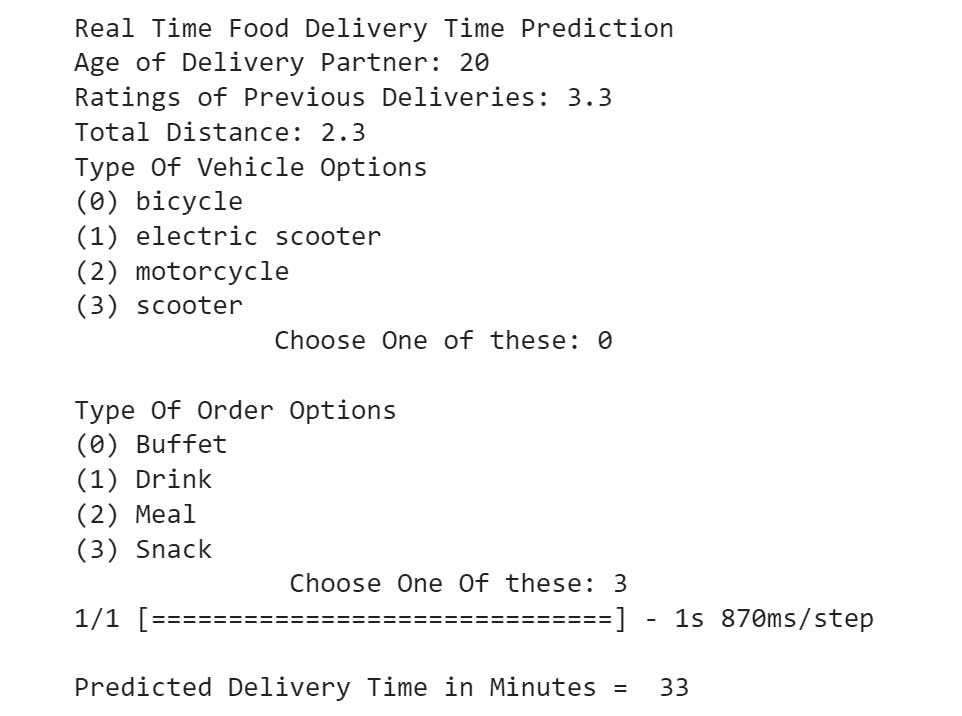
At this time I input some required values and the model predicts the actual time to take for delivery successful. ⏱️🤖
print("Real Time Food Delivery Time Prediction")
age = int(input("Age of Delivery Partner: "))
rating = float(input("Ratings of Previous Deliveries: "))
total_distance = float(input("Total Distance: "))
type_vehicle = int(input('''Type Of Vehicle Options \n(0) bicycle \n(1) electric scooter \n(2) motorcycle \n(3) scooter
             Choose One of these: '''))
type_order = int(input('''\nType Of Order Options \n(0) Buffet \n(1) Drink \n(2) Meal \n(3) Snack
              Choose One Of these: '''))
features = np.array([[age, rating, total_distance,type_vehicle,type_order]])
print("\nPredicted Delivery Time in Minutes = ", round(float(model.predict(features))))
